前言
这篇文章是我在接手 Crypto Meetup 这个项目之后在使用 Mapbox-gl 的时候遇到的一些问题的总结,以及相应的解决办法。因为国内关于 Mapbox-gl 的资料很少很少,所以查阅的时候大部分都是英文资料,我想,希望能够写下这篇文章,来帮助国内的一些开发者,能让你们也受众,这里也会给出一些很少人,很少论坛会引用到的,我查找到的一些资源,希望能够帮助到大家。
Crypto Meetup 是我在入职仙女座星系之后接手的第一个 Dapp 项目,目的是让用户之间可以共享地理位置,可以在持有特定 Fan 票的情况下,解锁他人的地理位置分享。虽然说叫 Dapp,但其实最终产品在写就的时候就没有太多关于区块链和去中心化的技术,使用的依然是 Vue 前端 + Koa2 后端这样的一个模式来完成的开发,最终部署到你们看到的网站的时候,也是依赖于中心化服务器提供的数据,所以说不算是一个严谨的 Dapp 吧,但是作为 Matataki 的一个小应用,还是蛮不错的,我在其中也学到了 Vue 项目的基本结构和如何构建的知识。
实现功能,问题本身
其实要实现的内容很简单,在 Crypto Meetup 可以看到,地球模式下,鼠标滑过国家地区的时候,会有高亮边缘的一个动画特效,我希望这个功能也能够在地图模式下实现。因为使用的是 Mapbox-gl-js,自然文档就要去 Mapbox 官网去找:https://docs.mapbox.com/mapbox-gl-js/api/ ,在这里就能看到所有的文档,这个页面还有一个中文版,但是为了保证原生的文档内容,我们在这里就使用英文文档提供的资料就好。
我查阅了文档本身提供的 Examples(用例),找到了这个 Create a hover effect(创建一个鼠标划过的特效):
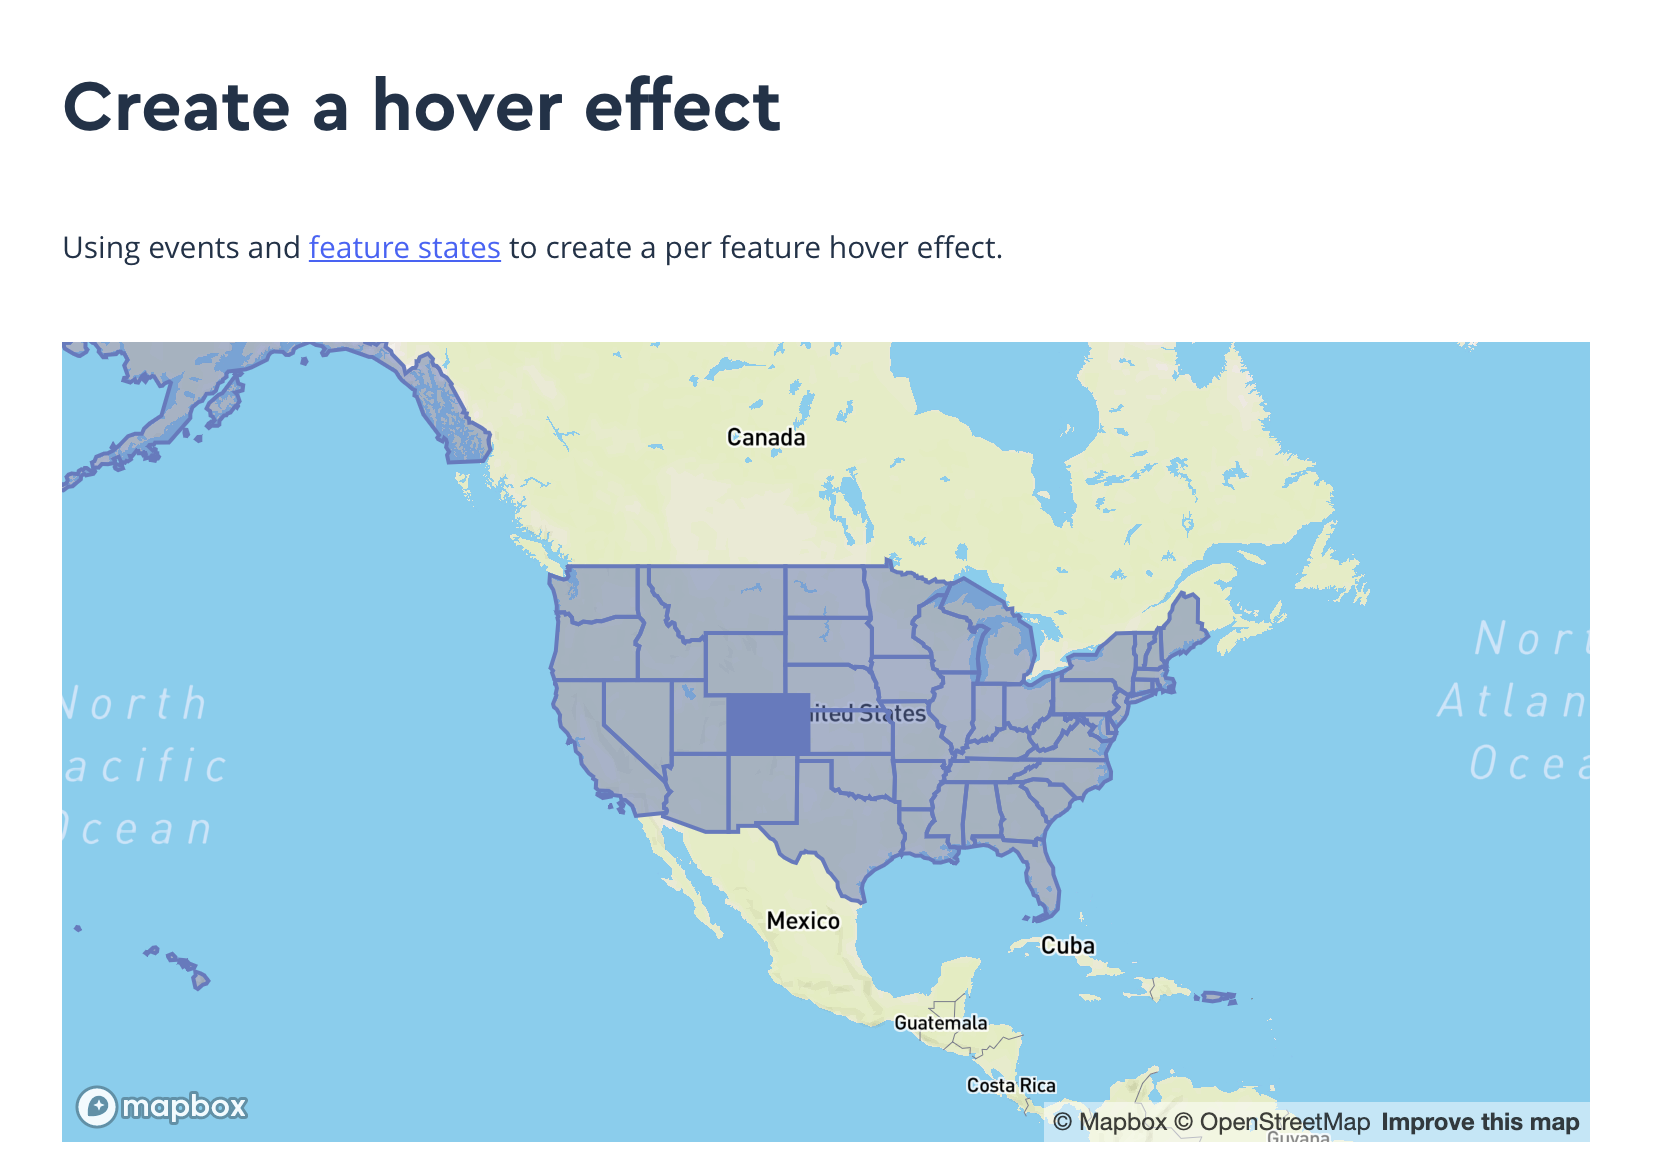
也就是我想要的鼠标滑动相关的内容,这个实现呢,就是一个鼠标滑动经过这些地图的区块的时候,我们鼠标下方的区块可以发生我们所设定的图像样式的变化,这个也就是我在接手这个项目的时候 3D 地球里面使用的鼠标滑动高亮的类似实现。看到这个文档的时候我就想,就是这个了。我们可以看看大致的文档内容是如何描述的。
这里是代码:
var hoveredStateId = null;

map.on('load', function() {
    map.addSource('states', {
      'type': 'geojson',
      'data':
      'https://docs.mapbox.com/mapbox-gl-js/assets/us_states.geojson'
      });

    // The feature-state dependent fill-opacity expression will render the hover effect
    // when a feature's hover state is set to true.
    map.addLayer({
      'id': 'state-fills',
      'type': 'fill',
      'source': 'states',
      'layout': {},
      'paint': {
        'fill-color': '#627BC1',
        'fill-opacity': [
          'case',
          ['boolean', ['feature-state', 'hover'], false],
          1,
          0.5
        ]
      }
    });

    map.addLayer({
      'id': 'state-borders',
      'type': 'line',
      'source': 'states',
      'layout': {},
      'paint': {
        'line-color': '#627BC1',
        'line-width': 2
      }
    });

    // When the user moves their mouse over the state-fill layer, we'll update the
    // feature state for the feature under the mouse.
    map.on('mousemove', 'state-fills', function(e) {
      if (e.features.length > 0) {
        if (hoveredStateId) {
          map.setFeatureState(
          { source: 'states', id: hoveredStateId },
          { hover: false }
          );
        }
        hoveredStateId = e.features[0].id;
        map.setFeatureState(
          { source: 'states', id: hoveredStateId },
          { hover: true }
        );
      }
    });

    // When the mouse leaves the state-fill layer, update the feature state of the
    // previously hovered feature.
    map.on('mouseleave', 'state-fills', function() {
      if (hoveredStateId) {
        map.setFeatureState(
          { source: 'states', id: hoveredStateId },
          { hover: false }
        );
      }
      hoveredStateId = null;
    });
});
官方给出来的代码原本还有一些是用来初始化地图和 mapbox-gl-js 这个 JavaScript Library 的,这一部分我会在另一篇文章来介绍是怎么样使用 Vue + Webpack + Mapbox-GL 来加载地图(这个方案可以代替百度地图或者是高德地图的 API),这些代码我就省略了,因为在 Vue 的实际使用中有不同的方案和方法。
代码分析
我们来看官方给出的参考代码是怎么描述的,这段代码分成三个部分来描述。
首先是第一点,我们要加载 Geojson 的资源进来。
加载 Geojson
map.addSource('states', {
  'type': 'geojson',
  'data':
  'https://docs.mapbox.com/mapbox-gl-js/assets/us_states.geojson'
});
这个地方使用的 Geojson 资源是 Mapbox 官方文档给的一个演示用 Geojson 文件。这里我们使用 map 对象的 addSource 方法加载了一个类型为 geojson 的数据,data 就是我们的 url (这里给出 URL 说明这个是一个可以自动生成一个 XMLHttpRequest 的,关于 XMLHttpRequest 的知识我们可以看:XMLHttpRequest - MDN)我们先略过这个部分,因为重要的实现不在这个地方。
添加图层 Layer
map.addLayer({
  'id': 'state-fills',
  'type': 'fill',
  'source': 'states',
  'layout': {},
  'paint': {
    'fill-color': '#627BC1',
    'fill-opacity': [
      'case',
      ['boolean', ['feature-state', 'hover'], false],
      1,
      0.5
    ]
  }
});

map.addLayer({
  'id': 'state-borders',
  'type': 'line',
  'source': 'states',
  'layout': {},
  'paint': {
    'line-color': '#627BC1',
    'line-width': 2
  }
});
在这里我们可以看到我们使用之前加载进来的 source:states 来标记我们为哪一个资源添加图层,这里是 states。我们在这里添加了两个图层,一个是填充(state-fills),一个是边缘(state-borders),他们的类型分别是 fill 和 line ,在 paint 对象里面还定义了填充的方式,以及 Mapbox 特有的对象编辑表达式:https://www.mapbox.cn/mapbox-gl-js/style-spec/#expressions
要了解这一点很重要,我一开始在开发的过程中看文档没有很清楚的描述表达式,在开发的过程中对这个 fill-opacity 对象就很疑惑,我们到底是怎么表达的。在这里我进行解释:
我们先把这个格式化好的代码变成一行:
'fill-opacity': ['case', ['boolean', ['feature-state', 'hover'], false], 1, 0.5 ]
这样方便我们去理解。
首先是第一个参数,case,在文档中被描述为:expression_name,表达式名称,也就是这个表达式运行的方式,是基于给定 case(状态)来判定后续代码的,接下来是第二个参数,是一个数组,这个数组又是另一个表达式,描述了 boolean 类型的工作方式(这部分可以参考 Expression Reference - Mapbox-GL ),我们可以看到这里定义了 feature-state 基于 hover 来变化,初始化值为 false,继续往下看,我们看到,当 boolean 返回 false 或者 true 的时候,就会运行后面的两个参数,并且赋值给 fill-opacity。
这个就是表达式的基本解读,这点十分十分十分重要,在其他 Mapbox 的实现的时候能够使用表达式做很多计算和预处理和数据解析,能够省去很多东西,还能借助 Geojson 的资源进行对应的计算来反映到实际的地图实例上。
接下来就是最后一部分代码。
绑定鼠标事件并且添加动态变量
map.on('mousemove', 'state-fills', function(e) {
  if (e.features.length > 0) {
    if (hoveredStateId) {
      map.setFeatureState(
      { source: 'states', id: hoveredStateId },
      { hover: false }
      );
    }
    hoveredStateId = e.features[0].id;
    map.setFeatureState(
      { source: 'states', id: hoveredStateId },
      { hover: true }
    );
  }
});

// When the mouse leaves the state-fill layer, update the feature state of the
// previously hovered feature.
map.on('mouseleave', 'state-fills', function() {
  if (hoveredStateId) {
    map.setFeatureState(
      { source: 'states', id: hoveredStateId },
      { hover: false }
    );
  }
  hoveredStateId = null;
});
分两段来阅读,第一部分是添加鼠标的事件:mousemove,也就是在鼠标移动的时候会运行下面的代码,如果鼠标悬浮的位置下方有有效的 feature,那么就赋值 id 并且设置 hover 对象为 true。
注意看代码的这个部分:
if (hoveredStateId) {
  map.setFeatureState(
  { source: 'states', id: hoveredStateId },
  { hover: false }
  );
}
hoveredStateId = e.features[0].id;
map.setFeatureState(
  { source: 'states', id: hoveredStateId },
  { hover: true }
);
这里说明了,我们改动变化的时候,改动的资源是 states,并且会把 hover 这个对象复制为两个不同的结果,也就是 true 和 false。
我们继续看下面的代码,
第二部分是绑定鼠标事件:mouseleave ,也就是鼠标离开某个对象的时候会运行下面的代码,这个代码把高亮起来的对象设置 hover 对象为 false,这样在之前的表达式中描述的地图效果就会应用到地图对象上。
问题在哪里?
我们现在了解了代码的使用方法和 API 的相关用法。我们改动一下数值,我们先载入一个我们的 Geojson 对象,然后看看会不会有什么变化。
这里我选用了:@geo-maps 海岸线 的 npm 包:https://www.npmjs.com/package/@geo-maps/countries-coastline-1m 提供的 json
我发现引入直接在 Vue 中引入这个 npm 包是无法正常解析的,于是我单独把文件拿出来,我们换个名字,叫:custom.geo.json
const geoData = require(‘custom.geo.json’)
接着继续引入。
我打开浏览器查看变化,发现什么都没有标记出来,为什么会这样?我查阅了很多资料都没有提到这个问题和相应的解决办法,甚至没有人提到这样的问题。我去翻阅文档的时候看到了一个十分重要的描述:getFeatureState() 这个方法的描述中有个很重要的解释:Features are identified by their feature.id attribute, which can be any number or string. 什么意思呢?就是说 Feature 是基于 feature.id 来定位的,这个值可以是一个数字或者是字符串,于是我看了看我的 custom.geo.json,他们并没有在这个里面标注 id 这个对象,我打开了 Mapbox 提供的那个 states.json 文件,看到了 id 的定义,还有一个 state_id,但是那个并不重要。
也就是说我们的 Mapbox 即便读取到了 Geojson 的数据,但是也不能基于 feature.id 给出特定的指向。我换了几个 Geojson 的资源,发现都是犯了同样的错误所以我不能很好的去设置 feature-state 的状态。
解决问题
无奈之下,我写了一个小小的脚本来完成这个任务:
const fs = require('fs')
let geoData = require("./custom.geo.json")
console.log(geoData.features.length)
for(let i = 0; i < geoData.features.length; i++) {
    Object.defineProperty(geoData.features[i], "id", {
         value: i,
         writable: true,
         enumerable: true
    })
}
geoData.features.forEach(e => console.log("1: ", e.id))
geoData.features.forEach(e => console.log(e.hasOwnProperty("id")))
console.log(geoData.features[0])

fs.writeFileSync("./customgeo.json", JSON.stringify(geoData))

let geoDataEdited = require("./customgeo.json")
geoDataEdited.features.forEach(e => console.log(e))
我们用原始的 Node 就可以跑起来,这里的 custom.geo.json 就是你的国家资源,也可以是省份区划,但是一定是 Geojson 结构的,我们在这里给每一个 feature 添加一个 id,并且赋值上去。
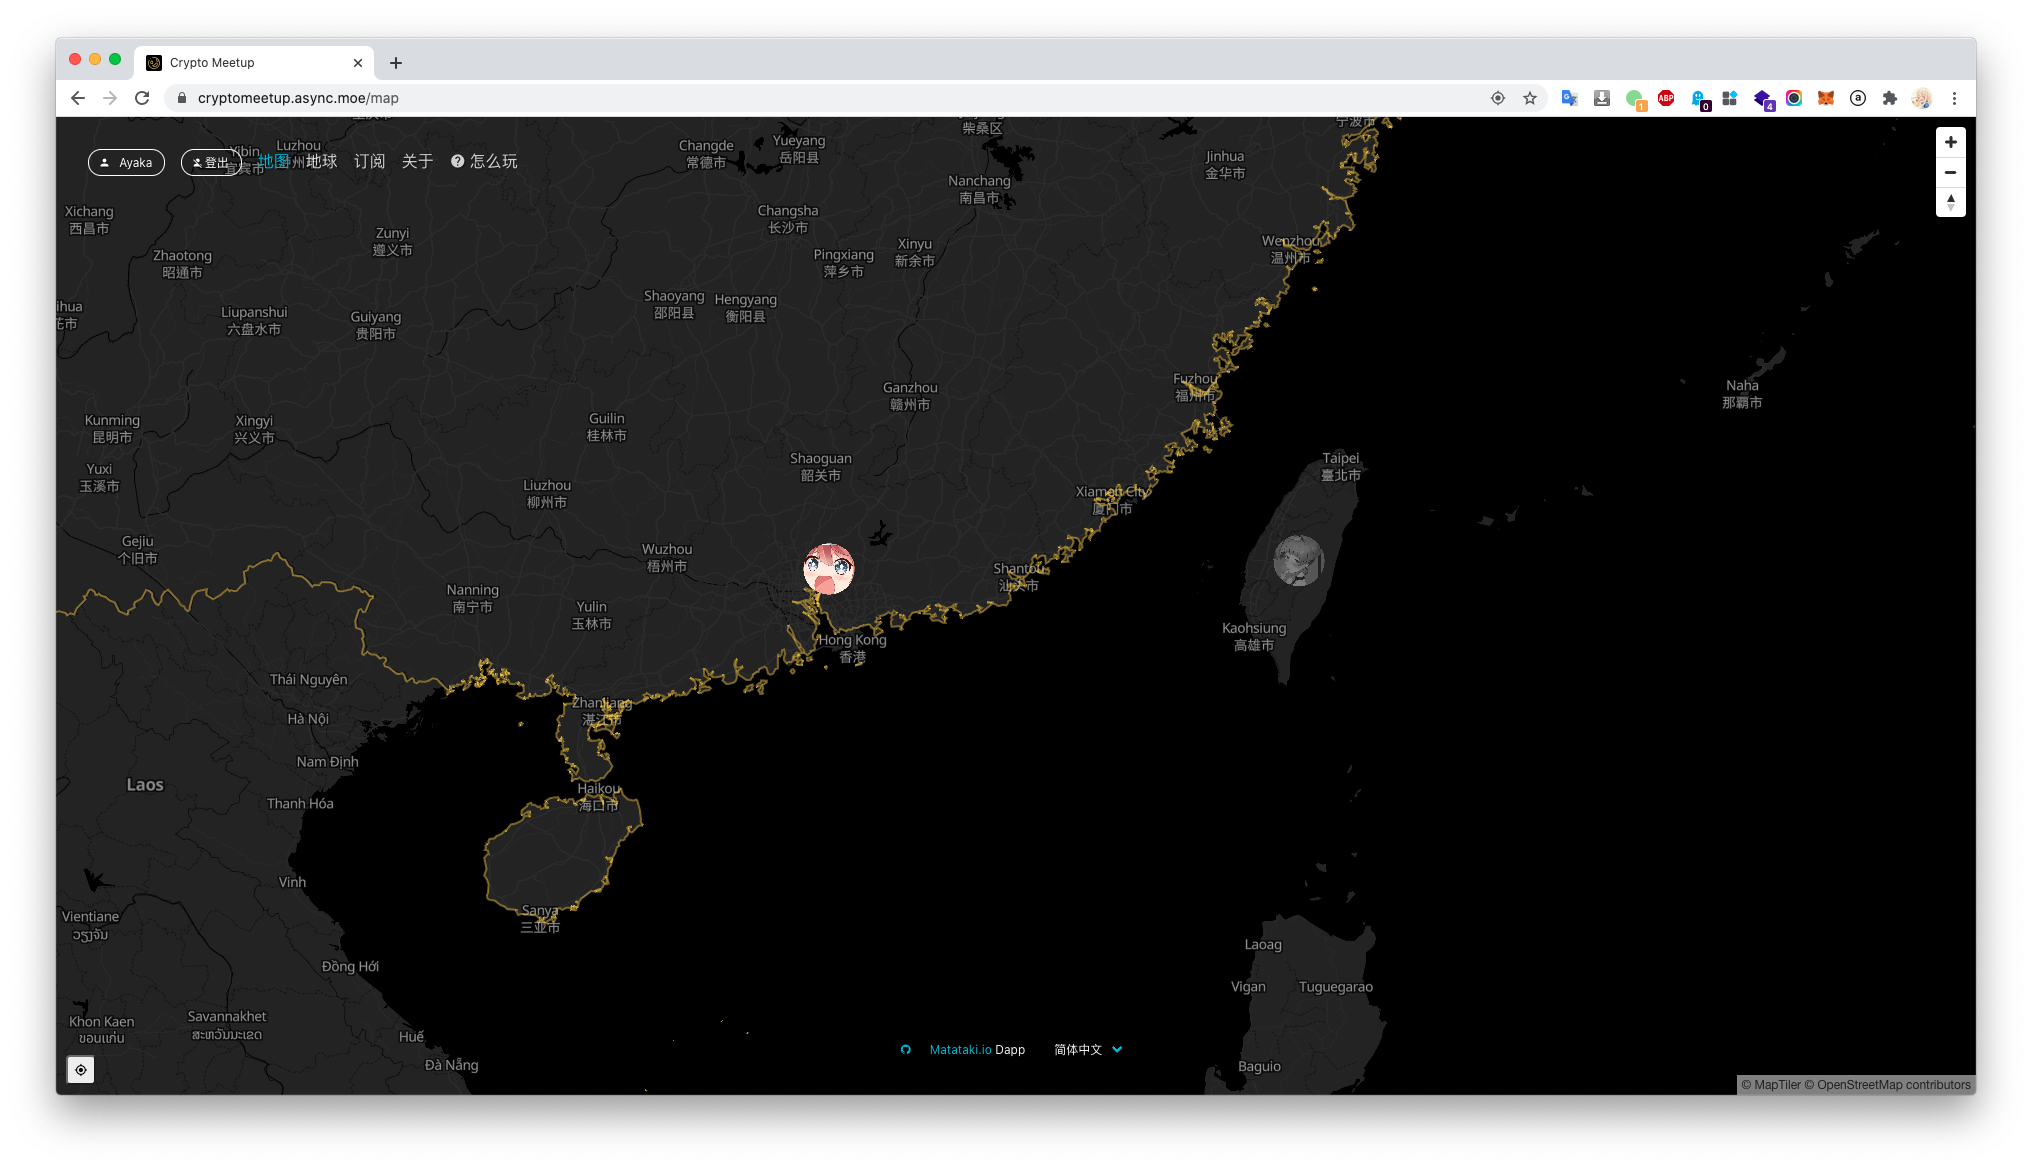
现在我们使用新的这个 customgeo.json 引入之后发现,可以使用了!
原因就是在于 feature.id 没有被定义就无法被 Mapbox 识别和标记。
因为我还需要高亮国家边界线所以我把原来的代码也修缮了一下:
map.addSource('countries', {
  type: 'geojson',
  data: geoData
});

// The feature-state dependent fill-opacity expression will render the hover effect
// when a feature's hover state is set to true.
map.addLayer({
  id: 'state-fills',
  type: 'fill',
  source: 'countries',
  layout: {},
  paint: {
    'fill-color': '#000',
    'fill-opacity': [
      'case',
      ['boolean', ['feature-state', 'hover'], false],
      0,
      0
    ]
  }
});

map.addLayer({
  id: 'state-borders',
  type: 'line',
  source: 'countries',
  layout: {},
  paint: {
    'line-color': '#FFD83F',
    'line-width': 2,
    'line-opacity': [
      'case',
      ['boolean', ['feature-state', 'hover'], false],
      0.5,
      0
    ]

  }
});

// When the user moves their mouse over the state-fill layer, we'll update the
// feature state for the feature under the mouse.
let hoveredStateId = null;

map.on('mousemove', 'state-fills', (e, i) => {
  if (e.features.length > 0) {
    if (hoveredStateId) {
      map.setFeatureState(
        { source: 'countries', id: hoveredStateId },
        { hover: false }
      );
    }
    hoveredStateId = e.features[0].id;
    map.setFeatureState(
      { source: 'countries', id: hoveredStateId },
      { hover: true }
    );
  }
});

map.on('mouseleave', 'state-fills', () => {
  if (hoveredStateId) {
    map.setFeatureState(
      { source: 'countries', id: hoveredStateId },
      { hover: false }
    );
  }
  hoveredStateId = null;
});
添加用户头像到地图上
我原本以为这个功能是十分容易理解的:
map.addImage(avatar, image);
map.addSource('user-avatar', {
  type: 'geojson',
  data: {
    type: 'FeatureCollection',
    features: [
      {
        type: 'Feature',
        geometry: {
          type: 'Point',
          coordinates: position.data
        }
      }
    ]
  }
});
map.addLayer({
  id: 0,
  type: 'symbol',
  source: 'user-avatar',
  layout: {
    'icon-image': avatar,
    'icon-size': 0.08
  }
});
- 我们创建一个新的 Geojson 对象,这个对象包含了一个 FeatureCollection
- Feature 是一个点,点对应的是一个坐标
- 我们在这个对象里添加一个图层,这个图层是一个图标,是一个图像文件。
可是我们需要做到的是显示多个用户的头像到这个地图上,我在开发的时候却怎么也做不到。
最后还是查阅文档发现了一个很重要的内容,我们添加的这个 source id 也是独立的,我们的 layer id 是独立的,我们的头像才可以多个显示出来,因为这样才有独立的 id 可以被 Mapbox 区分开来。
所以最后我们需要修改的部分就是添加图层的部分和添加 source 的时候的不同:
const itemId = 'id' + element.userId
const avatar = 'avatar' + element.userId
if (error) throw error;
map.addImage(avatar, image);
map.addSource(itemId, {
  type: 'geojson',
  data: {
    type: 'FeatureCollection',
    features: [
      {
        type: 'Feature',
        geometry: {
          type: 'Point',
          coordinates: position.data
        }
      }
    ]
  }
});
map.addLayer({
  id: itemId,
  type: 'symbol',
  source: itemId,
  layout: {
    'icon-image': avatar,
    'icon-size': 0.08
  }
});
我不得不创建两个独立的 id 来针对 source 和 图层 进行标记才行。
最后
希望我的这篇文章能够给你提供帮助,因为国内外的资源都相当稀缺,很多弯路都是在这个不断的实验中得出的。希望我的这些代码分析和小脚本能够在你的项目当中给你提供足够的帮助。
再一次,感谢你一路阅读到这里,谢谢你的支持。
引用,参考,和相关资源
Vue-Mapbox-GL
https://github.com/phegman/vue-mapbox-gl
介绍和使用 Geojson 相关的资料
http://blog.infographics.tw/2016/01/draw-map-with-geojson-io/
http://geojson.io/#map=2/20.1/0.0
https://www.mapbox.cn/mapbox-gl-js/example/hover-styles/
https://geojson-maps.ash.ms/
https://datahub.io/core/geo-countries
下载和使用开放的 Geojson 的网站
https://www.naturalearthdata.com/
Geojson 和 Mbtiles 绘制的软件和项目
https://www.qgis.org/en/site/forusers/download.html
各个国家和世界地图的 Geojson 文件(GitHub)
https://github.com/mledoze/countries
https://github.com/johan/world.geo.json
https://github.com/simonepri/geo-maps